Reports
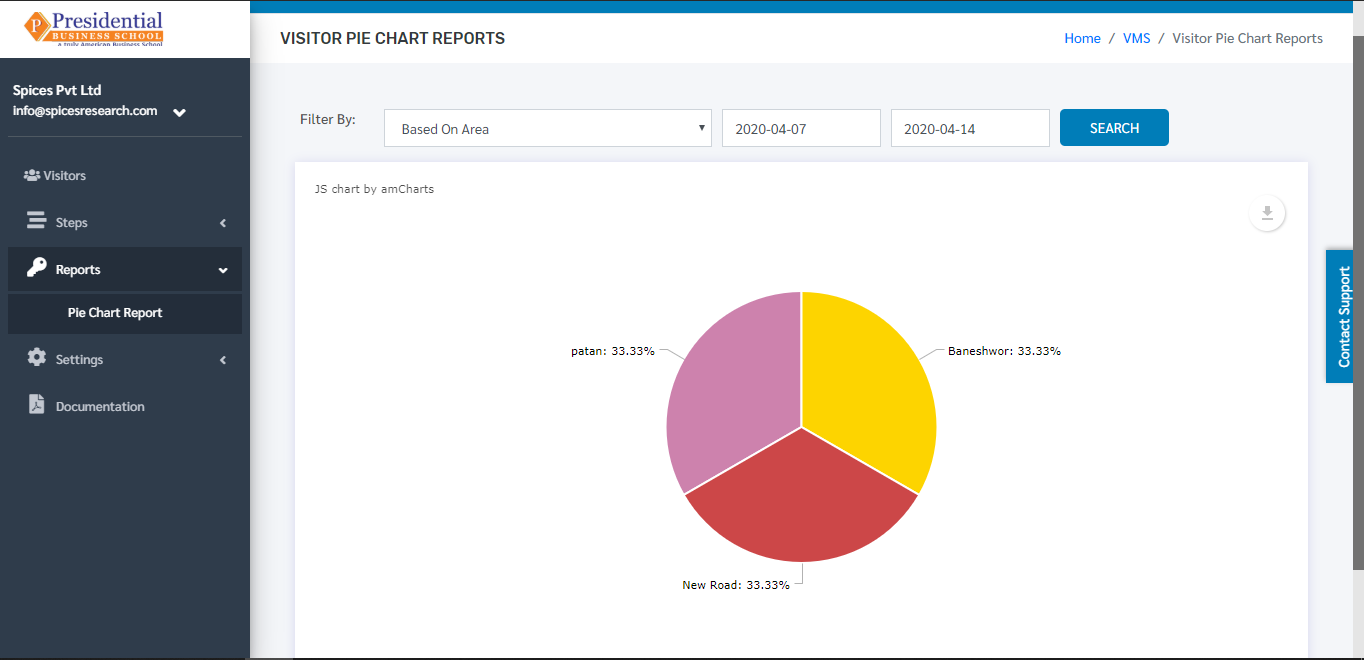
This sub-module provides detailed pie chart reports of enrolled students on the basis of Area, Districts and Institutions.
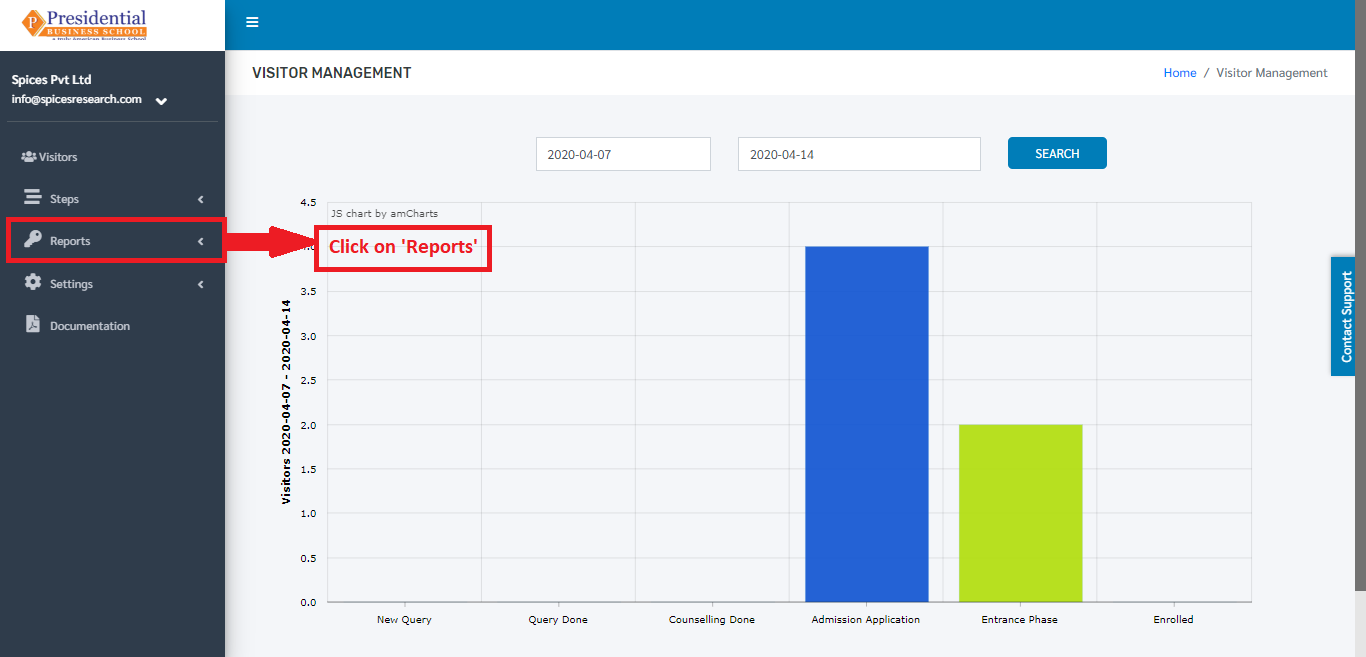
Users must click on ‘Reports’ on the left hand side of the dashboard to access it. This is done by the following process.
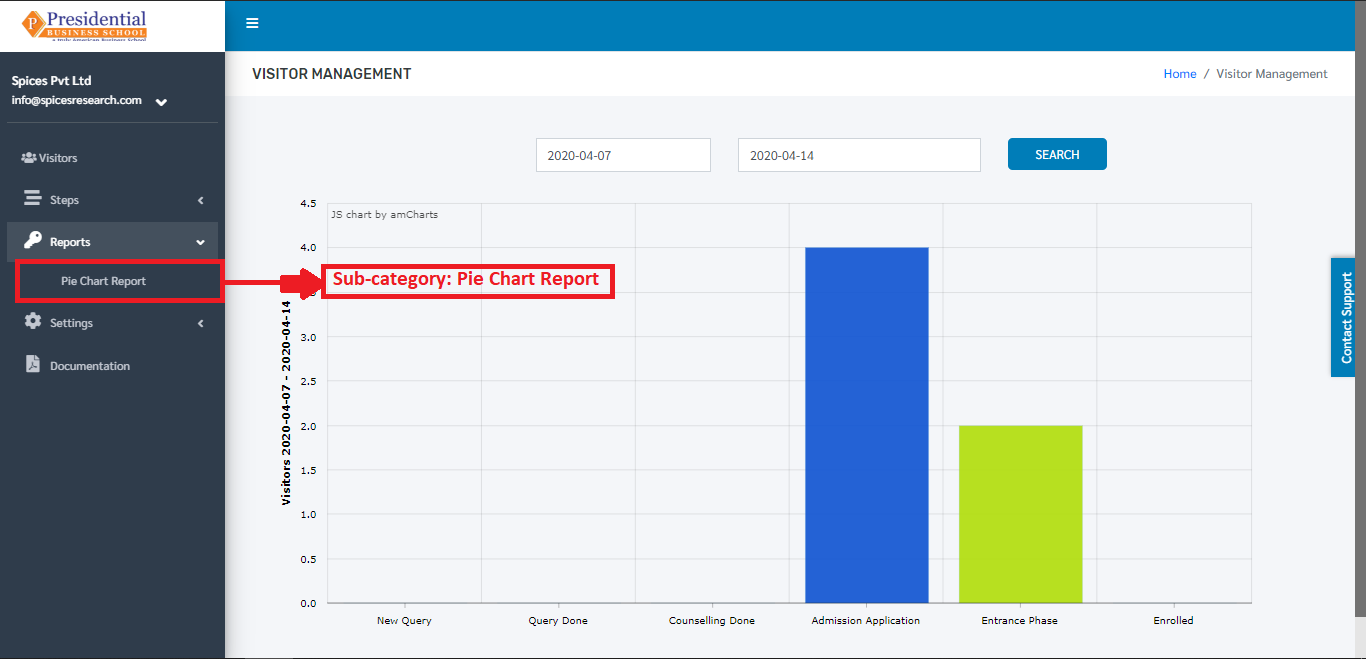
On clicking on Reports, a subcategory will appear which is ‘Pie Chart Report’.
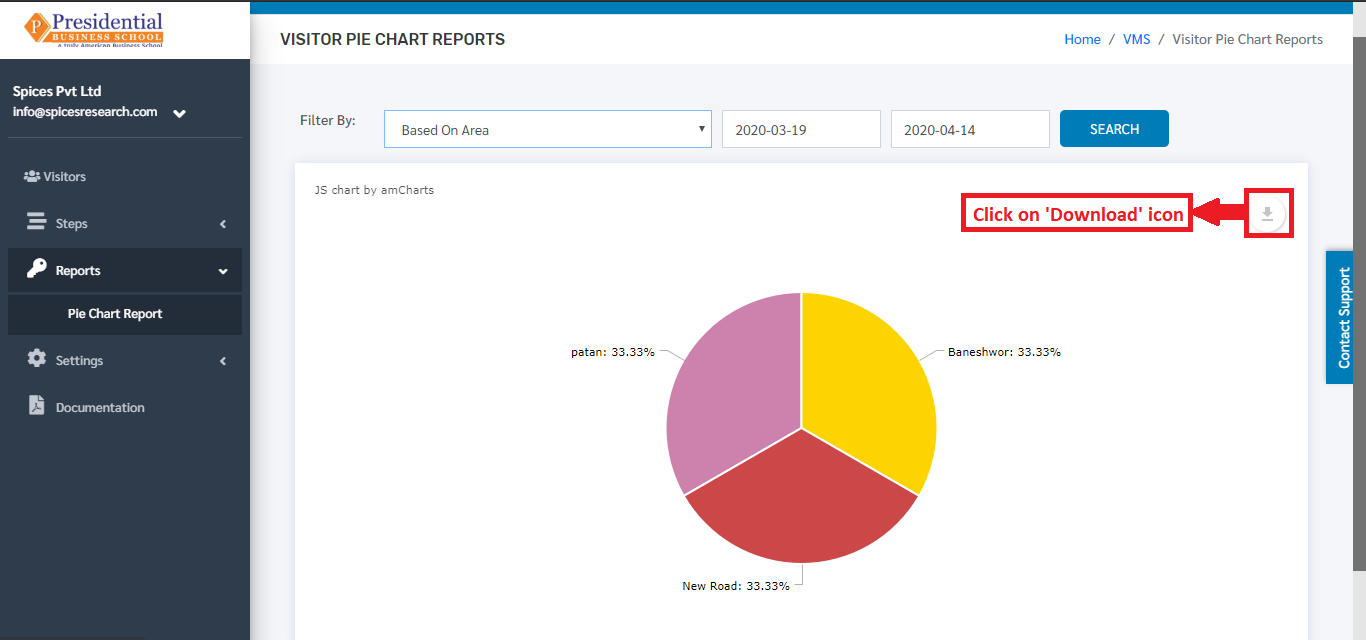
On clicking ‘Pie Chart Report’, the following page will appear.
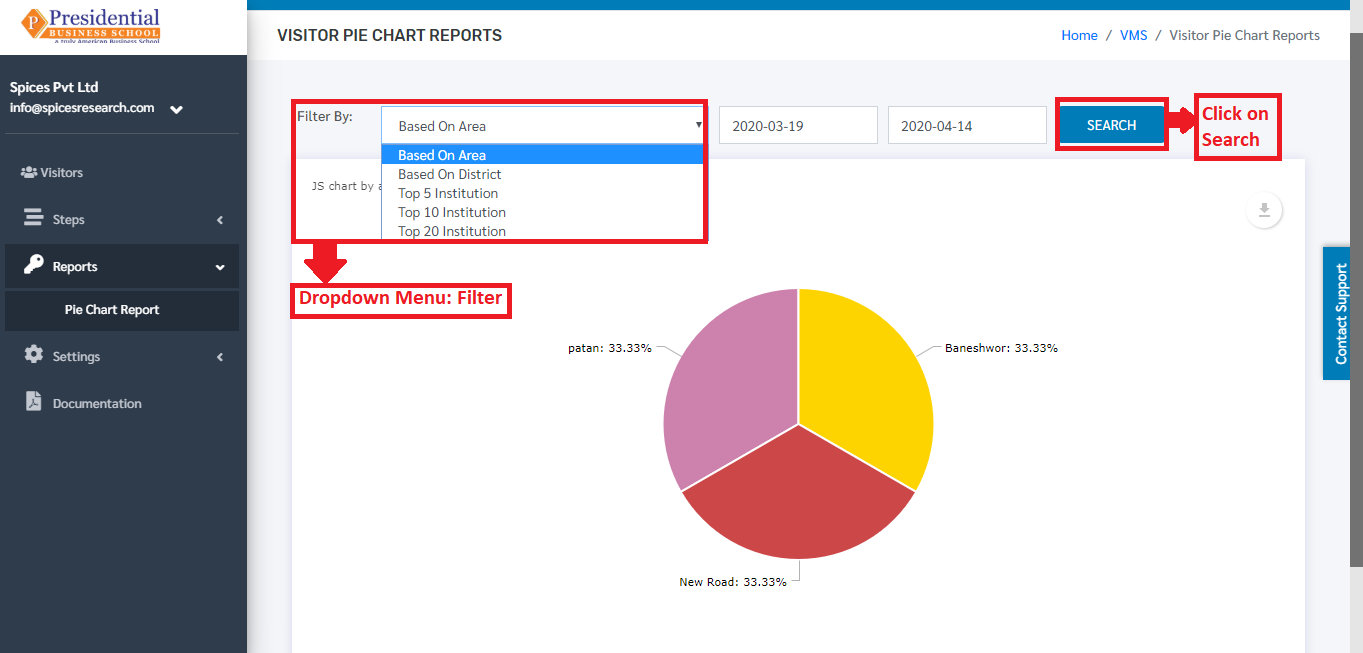
The pie chart report can be viewed on the basis of Area, Districts, Top 5 Institutions, Top 10 Institutions, Top 20 Institutions. This filtering is done by selecting the options from the drop-down menu ‘Filter By’ and then clicking on ‘SEARCH’ button.
The pie-chart report can be downloaded in different forms as well. This is done by clicking on the ‘Download’ icon on the top right hand side of the page.
On clicking the ‘Download’ icon, different options are available as shown in the picture below.
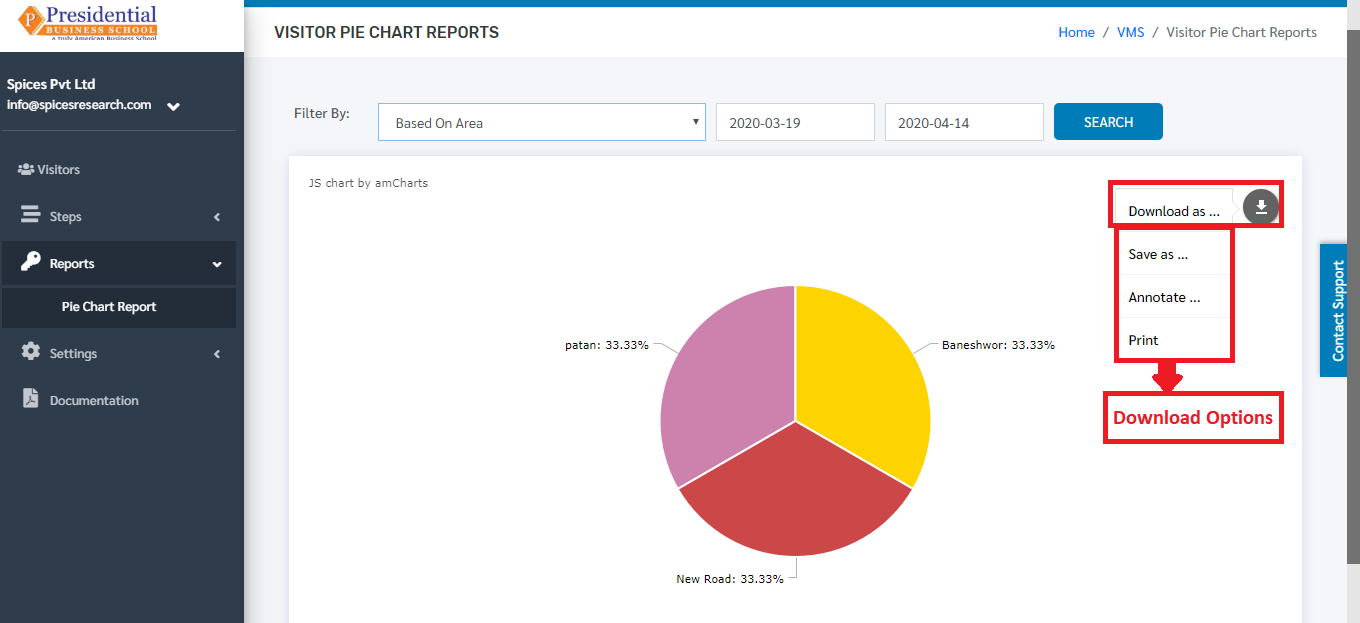
Preferred Download Option can be selected to download the Pie-Chart Report. The file will be downloaded once the desired option is selected.